History of the Virtual Astronomical Observatory
Winds of Change
Astronomy has historically been a fragmented science. Astronomers
would typically work alone or in small research groups to conduct
observations of small, carefully selected samples (often with a priori
prejudices) of objects in a limited part of the electromagnetic
spectrum. Results were not always shared with the public and, if they
were, they were shared passively without an active role from
interested students, teachers, amateur astronomers, and the general
public.
A paradigm shift
In the past decade, a paradigm shift has begun that will
forever change how astronomical research is conducted and shared with
the public. Astronomers are now increasingly working in large
collaborations using survey telescopes or multiple telescopes covering
a wide range of the electromagnetic spectrum.
Astronomers today have
more data at their disposal than at any other time in history. This
paradigm shift is occurring because of the following four main drivers
of change:
More powerful telescopes
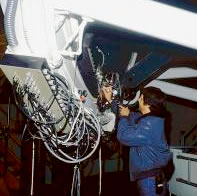 Checking cables on the Mayall 4-meter telescope at Kitt Peak
Larger and more sophisticated telescopes are able to take more high
resolution images and spectra of the universe. Over the past couple
of decades, a new type of telescope became popular, the survey
telescope. These telescopes were not developed to target specific
objects, but were instead developed to survey much of the sky.
Astronomers could then look for specific objects or do a census of
objects over much of the sky. Astronomy was now going to get
statistically large samples of objects in the universe to
study.
Current surveys include the Sloan Digital Sky Survey (SDSS),
the Two Micron All Sky Survey (2MASS), the Massive Compact Halo
Objects (MACHO), and the ROSAT All Sky Survey (RASS). The future
Large Synoptic Survey Telescope (LSST — scheduled to begin
science operations later this decade) will produce a wealth of data by
repeatedly scanning the sky over a 10-year period. The LSST will not
just produce a map of the universe, but will discover all sorts of objects
that change between observations, giving us insight into whole new
classes of variable objects.
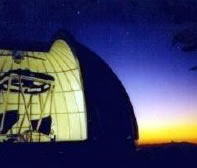 Mt. Hopkins 1.3-Meter Two Micron All Sky Survey (2MASS) Telescope
Along with the advent of survey telescopes, astronomers are finally
able to probe larger swaths of the electromagnetic spectrum with
fleets of ground- and space-based telescopes. We now have telescopes
observing the universe from high energy gamma rays, to visible
light, down to low energy radio waves. Many of these
telescopes are launched into space as a necessity; many types of light
of the electromagnetic spectrum, such as gamma rays, X-rays, ultraviolet, and infrared
light, cannot pass through Earth's
atmosphere.
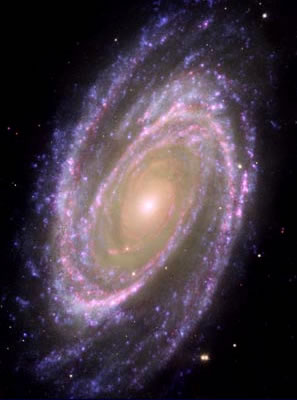 M81: Hubble/GALEX/Spitzer composite image
From these advances in telescope design, the general public now has
access to multiwavelength images. Student projects are being
developed to teach the power of using the full electromagnetic
spectrum to study the universe. The sure amount of data from surveys
and powerful telescopes allow anyone interested to become citizen
scientists, who are helping astronomers classify objects in the universe, do
population studies of objects in the universe, and even discover new objects.
Detectors that are larger, more sensitive to light,
and have higher resolution
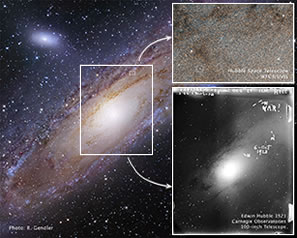 Changing view of the Andromeda Galaxy
Background: Modern day, ground-based, digital detector image; Bottom right: Carnegie Observatory photographic plate image, by Edwin Hubble, 1923; Top right: Recent image, by Hubble Space Telescope.
While the mirrors or optics in telescopes act as giant light
buckets collecting as much light as possible, the detectors capture
that light for us to study.
In the earliest days of telescopic
astronomy, astronomers could only use their eyes as detectors. If
they wanted to show another person their discoveries, they had to draw
what they saw by hand. This was obviously a very imprecise way to
practice astronomy, and the eyes are only capable of detecting visible
light.
By the late 19th century, photographic plates were used to
capture the light gathered by telescopes. This was far superior to
using eyes, since photographic plates could be exposed to incoming
light for hours at a time, thus building up images of fainter
objects. Photographic plates did have several disadvantages. They
were heavy, difficult to process, and not as accurate as modern day
detectors.
 Students using computers for class projects
All of the new advances in telescope design are taking advantage of
more advanced detectors that can accurately count individual photons
of light.
Modern day detectors are called charge-coupled devices
(CCDs) and are used in everything from common digital cameras to the
most state-of-the-art telescope. Each CCD is made up of individual
light-sensing pixels. The more individual pixels packed onto a given
size of CCD, the better the resolution of the resulting image.
Higher
resolution images are more clear and detailed. Lower resolution
images appear increasingly blurry. Currently, the typical
cameras purchased by a consumer have detectors with less than 20
million pixels. Astronomical-grade cameras use various types of
detectors that can produce sharper images and capture larger swaths of
the electromagnetic spectrum. As a comparison, the SDSS telescope has
a 120-million-pixel detector. The future LSST will have a 3,200-million-pixel detector.
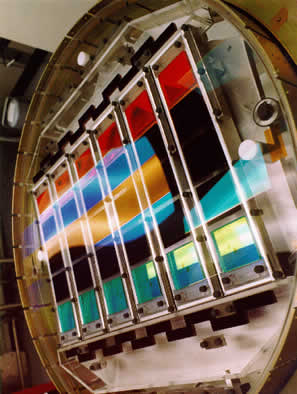 The Sloan Digital Sky Survey camera incorporates thirty 2048x2048-pixel CCDs
The higher resolution images produced by state-of-the-art
astronomical-grade detectors are leading to a huge increase in data.
Each individual pixel is actually data that must be recorded for
analysis. These are producing incredibly detailed images in multiple
wavelengths for the general public to admire. Amateur astronomers can
purchase their own detectors for use on their backyard telescopes to
create images that sometimes rival several ground-based research-level
telescopes. Students also now have access to higher quality
astronomical data.
Exponential growth of computing capability
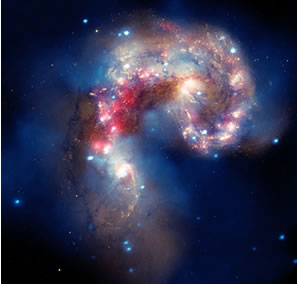 The colliding Antennae galaxies: Image
combines X-ray data (Chandra Observatory), visible light
(Hubble Space Telescope), and infrared light (Spitzer Space Telescope)
The colliding Antennae galaxies: Image
combines X-ray data (Chandra Observatory), visible light
(Hubble Space Telescope), and infrared light (Spitzer Space Telescope)
The current technological explosion of telescope and detector
capabilities is producing a huge amount of data. With this, we
require more powerful computers to store and analyze the data. The
SDSS, alone, is producing terabytes of data. The future LSST will
produce more than 50 petabytes of data. One petabyte is equivalent to
the amount of data obtained by all of CNN's news footage over five
years.
Thankfully, computing capability has greatly increased,
following the famous Moore's Law. Moore's Law states that
computing power doubles every 18 months. This increase in computing
power is critical to keep up with the increasing flow of data by
detectors on telescopes. Incidentally, the rate of increase of the
numbers of pixels on a CCD detector, or the quantity of data collected
by that detector, also follows Moore's Law.
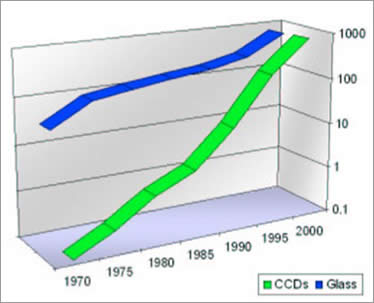 Moore's Law holds true in astronomy: Blue curve
is total area of astronomical telescopes (glass), in square meters.
Green curve is growth of CCDs, in billions of pixels. The amount of data
being collected (green line) is following Moore's Law.
Moore's Law holds true in astronomy: Blue curve
is total area of astronomical telescopes (glass), in square meters.
Green curve is growth of CCDs, in billions of pixels. The amount of data
being collected (green line) is following Moore's Law.
The growth of computer usage in homes and schools is providing the
necessary infrastructure for the general public and students to study
and use the astronomical data. Along with the advent of high-speed
internet, as described below, the public now has the means to help
carry out astronomical studies where large numbers of computers and/or
users are required.
Expanding coverage and capacity of communication networks
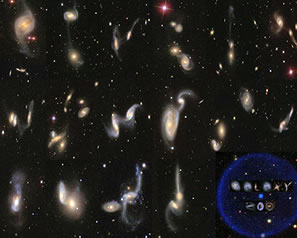 Galaxy Zoo citizen science project: Interested
citizens are helping astronomers classify galaxies and
define the pantheon of galaxy shapes in the universe.
Galaxy Zoo citizen science project: Interested
citizens are helping astronomers classify galaxies and
define the pantheon of galaxy shapes in the universe.
Due to the increased computer power, along with the development of
high-speed internet and broad internet coverage, astronomy is primed
to take advantage of the wealth of astronomical data.
In 2002, it
would take about 20 days to transfer one terabyte of data over the
internet. In 2012, using an internet connection of 10 megabytes per
second, it would take about 10 days to transfer one terabyte of data.
With faster connection speeds, this can be reduced to a few days.
The
speed of internet connections will continue to increase in the years
ahead. With the spread of the internet, users can have nearly instantaneous access to the
large data archives spread around the world.
Users will also have access to internet cloud storage and online tools
that help them analyze the data. This will create less reliance on
having the absolute best computer in your home, office, or school.
These infrastructure gains will help pave the way for the discovery of
new phenomena and previously undiscovered patterns in data, and will allow simultaneous
access to astronomical data archives with access to images and spectra
taken by the world's most powerful ground- and space-based
telescopes. These gains will also allow broad access by anyone with internet access, and result in new
learning and analysis tools.
The paradigm shift stokes discovery
 More and more students use computers with high-speed internet access, allowing
for state-of-the-art projects using astronomical data
More and more students use computers with high-speed internet access, allowing
for state-of-the-art projects using astronomical data
There are several examples of how any combination of the above four
key changes can influence astronomical discoveries.
Historical
examples include the discovery of quasars when viewed using multiple
portions of the electromagnetic spectrum (radio and visible light in
this case). Extremely luminous objects in the universe were
discovered when viewing in the infrared. These bright objects were
hidden behind thick clouds of dust that block visible light but glow
brightly from the heated dust emitting infrared light. It is believed
that nearly half of all star forming regions may be escaping detection
when using only visible light for their detection. The properties of
cosmic gamma ray bursts, extremely powerful explosions in the universe
thought to come from exploding stars and colliding stellar remnants,
are being understood now due to observations from multiple portions of
the electromagnetic spectrum, including X-rays, visible light, and
radio waves. What else is out there? What more can we learn? We now
have the capabilities to answer these questions.
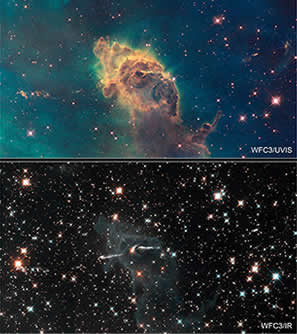 Stellar Jet in the Carina Nebula
This change is happening, but how do we take advantage of it? How do
we make sure the public also gains the benefits of this "new
astronomy?" The answer is to create a "virtual observatory" (VO) — virtual, in that the user obtains and interacts with the data via
web-based tools, and an observatory in the traditional astronomical
sense, in that it will be a general purpose instrument, as opposed to an
instrument designed for one specific purpose or goal.
Laying the Foundation of a National Virtual Observatory
The idea to create a National Virtual Observatory (NVO) was
presented in the National Research Council's decadal review, "Astronomy and Astrophysics in the New Millennium," released in 1999
and published in 2001. The decadal review sets the national priority
for astrophysics for the following decade. In the review, the
NVO was rated the highest priority for small (less than 100 million
dollars) projects. From the decadal review:
"The NVO will provide a 'virtual sky' based on the enormous data
sets being created now and the even larger ones proposed for the
future. It will enable a new mode of research for professional
astronomers and will provide to the public an unparalleled opportunity
for education and discovery."
In response to the recommendation given in the decadal review, NASA
and the National Science Foundation (NSF) established the Science
Definition Team (SDT). The SDT created a report in April 2002, entitled "Towards the National Virtual Observatory." The goal of the
SDT was to lay out a plan for implementing the NVO with real proposed
science projects as the motivation and direction.
Linking the archives
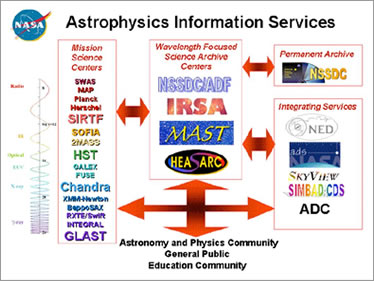 NASA telescopes (listed at left) archive their data at various wavelength-specific
science archive centers (center, top). The NVO plays the role of the central
arrows, allowing users one place to connect to all NASA data.
NASA telescopes (listed at left) archive their data at various wavelength-specific
science archive centers (center, top). The NVO plays the role of the central
arrows, allowing users one place to connect to all NASA data.
All of the major NASA missions, along with other national and
international missions, store their images and spectra in data
archives. There is a wealth of information from those images that has
not been explored. That data belongs to the scientists who first
proposed the experiment, typically, for about a year. After this
period, the data become available to anybody, including the general
public. Each archive traditionally sorted and accessed data using
their own standards. The archives did not communicate with each
other. In the era of multiwavelength, time-domain, and survey
astronomy, this is a roadblock to doing good science.
The NVO was
tasked with overcoming these barriers by creating common standards by
which the archives would catalog their data and communicate with
users. In so doing, the NVO would be a one-stop destination where a person
could easily access data from any or all of the archives instead of
searching separately.
In many ways, the NVO was equivalent to today's airline or hotel
reservation systems like Travelocity or Expedia. A traveler can use
these services to compare prices, schedules, and amenities among
airlines or hotels. The user can choose the hotel or airline that suits
them the best. The NVO, likewise, was envisioned to be a central
place where astronomers, students, educators, or any other interested
user could find images or spectra of any type of object, from any
archive.
 The NVO was equivalent to today's airline or hotel reservation systems like Travelocity or Expedia.
To successfully create this centralized hub of data access and
analysis, the SDT envisioned a three-phase process to implement the
NVO:
- Phase I: Conceptual design of the NVO, expanded definition of the
science that will drive the development of the NVO, implied technical
capabilities, management structure and costing issues.
- Phase II: Definition of the NVO operational/management structure, a
detailed implementation plan, increased capabilities implemented
within existing data centers/archives/surveys/observatories, and
increased community input and involvement.
- Phase III: Implementation of the full-fledged NVO structure with
international connections, the start of NVO-based science programs,
and the start of routine operations.
Even in this earliest phase of a national virtual observatory, plans
were being formulated on how to capitalize on the unique capabilities
of the NVO to teach science, technology, engineering, and math (STEM)
subjects. From "Towards the National Virtual Observatory":
"The NVO effort also provides a unique opportunity to enhance
technology literacy in a broad sense. The NVO will inform, excite,
and educate the public about space science and astronomy, and serve as
a catalyst for scientific and technological literacy in the United
States."
Success of the NVO
The NVO was an ambitious project that was clearly defined by the
SDT. In the report by the SDT, it was noted that the foundational and
infrastructure problems had to be solved before any operational VO
could be put into place.
By the end of the NVO funding in 2010, many
of these issues had been solved. There was a management, operations,
and organizational structure in place, which is critical for a
geographically distributed project like the VO, which has member institutions
from all over the U.S. and the world.
A new set of VO-standards
were implemented into most of the large astronomy data archives for
simple retrieval of information. These standards were created and
adopted across the world with the help of the newly formed
International Virtual Observatory Alliance (IVOA), which presently
includes more than 20 nations with individual VO programs. These
include the United States, France, Germany, Canada, China, India,
Italy, United Kingdom, Japan, Brazil, Australia, and more.
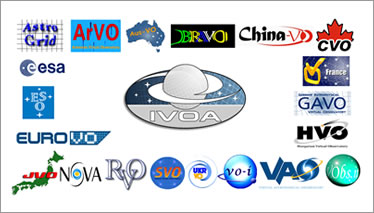 The International Virtual Observatory Alliance (IVOA) is
made up of virtual observatory projects from a multitude of nations and regions.
The International Virtual Observatory Alliance (IVOA) is
made up of virtual observatory projects from a multitude of nations and regions.
The NVO and international VO programs were not the only groups
building and supporting VO infrastructure and tools during the decade.
Microsoft Research was one such leading organization. In 2001, Jim
Gray, of the Microsoft Research Center, and Alexander Szalay, who was
one of the principal investigators of the NVO, wrote up a viewpoint
article for Science, entitled "The World-Wide Telescope."
In this
article, the justifications for embarking on a national virtual
observatory were given, including strong educational motivations.
In the article, Gray and Szalay made a point that the VO can help
educate the students and the general public in areas such as
astronomy, physics, chemistry, computational science, and mathematics.
The efforts of Microsoft Research's VO efforts have led to the
development of the WorldWide Telescope (WWT), a beautiful
visualization tool that makes use of the VO infrastructure to provide
real astronomical images. Microsoft has dedicated the WWT to Jim Gray, who was lost at sea in 2007 during a
solo boating trip.
Champions of the WorldWide Telescope
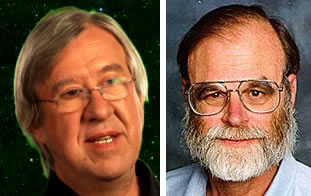 Alex Szalay (left) and Jim Gray (right), advocates for the WorldWide Telescope.
Szalay was one of the principal investigators of the NVO; Jim Gray, of the
Microsoft Research Center, was lost at sea in 2007 during a solo boating
trip. Microsoft has dedicated the WWT to Jim Gray.
Alex Szalay (left) and Jim Gray (right), advocates for the WorldWide Telescope.
Szalay was one of the principal investigators of the NVO; Jim Gray, of the
Microsoft Research Center, was lost at sea in 2007 during a solo boating
trip. Microsoft has dedicated the WWT to Jim Gray.
With the groundwork laid out by the NVO and its national and
international partners, the time to use the VO is here. Some tools
have been developed for the VO and many more are in the pipeline for
use by both professional astronomers and the general public. These
tools have features that allow the user to acquire data,
analyze data, and learn about the universe through beautiful
visualizations.
With the NVO era now over, a new organization has
been funded in its place, with the explicit goal of creating useful
tools for users to take advantage of the groundwork laid by the NVO.
To carry on with the NVO's goals, we hereby introduce you to the Virtual
Astronomical Observatory.
The Establishment of the Virtual Astronomical Observatory
The Virtual Astronomical Observatory (VAO) is the U.S. NSF- and
NASA-funded VO effort that seeks to put efficient astronomical tools
in the hands of U.S. astronomers, students, educators, and public
outreach leaders. From the Mission Statement in the "VAO Project
Execution Plan (2010)":
"The VAO, building on the success of prior infrastructure
developments, is now poised to realize the benefits long-promised to
the astronomical research community, and more generally, educators and
the general public."
The VAO has a current funding and development path for five years.
Many tools are being developed by the VAO and its national and
international VO collaborators to make accessing and analyzing
astronomical data simple and intuitive for professional astronomers
and the general public. Some of these tools include:
- Data Discovery Tool — Retrieve
astronomical data about a given position or object in the sky.
- Aladin — Find and overlay images from different parts of the
electromagnetic spectrum.
- Cross-comparison tool — Find all objects of a given type or at a
given location between all archives.
- IRIS — Find, plot, and fit spectral energy distributions
(SEDs). SEDs are the brightness profiles of objects at many
wavelengths.
- VOPlot — Plot results from VO queries.
- Skyalert — Monitor real-time alerts of transient events.
These include variable stars and supernovae.
- Time series tool — Obtain an object from multiple
archives/observations to analyze how it varies its light output with
time.
- Montage — Make large mosaic images of survey data.
- Microsoft's WorldWide Telescope — Explore the universe and look at astronomical
images taken by many of the world's telescopes with this visualization software. WWT has the unique
feature of allowing the user to create special tours around objects
that can be shown as video to others.
- Google Sky — Explore the universe and look at astronomical images taken by many
of the world's telescopes with this visualization software.
Most of these tools can be found by going to the VAO science site,
here. WWT can be found here, and Google Sky can be found here. To
help develop and refine the tools, the VAO is working with science
teams and EPO professionals. Some of the current science teams run
the gamut from those that study star formation and evolution to those
that study galaxy formation and evolution.
The VAO has firmly established an E/PO program to deliver the
capabilities of the VO to students, educators, amateur astronomers,
citizen scientists, and the general public. From a 2010 founding document
of the VAO, entitled "A Vision for the US Virtual Astronomical
Observatory":
"The VAO will be an invaluable resource in any effort to address public
science literacy through the use of astronomy; its rapid access to
astronomy data, archives, images and literature through a single point
of contact will facilitate the creation and maintenance of programs
designed to increase public awareness of science."
See the "E/PO" page to learn about the plans for the VAO E/PO program. See the "About Us" section to learn more about the VAO E/PO
team.
United States Virtual Observatory Timeline
2000: Decadal Review names the National Virtual Observatory (NVO) as
the top small initiatives project.
2001 July - March 2002: Science Definition Team (SDT) formed in response to
Decadal Review
2001, April 23: ITR/IM: "Building the Framework for the National
Virtual Observatory" submitted. This is a copy of the original proposal
to NSF's Information Technology Research (ITR) Program.
2002, April: "Toward the National Virtual Observatory," a report
prepared by the National Virtual Observatory Science Definition Team
2002, June: International Virtual Observatory Alliance (IVOA) founded
2002, July 12: White paper published
2004: First NVO Summer School, The Aspen Meadows Resort, Aspen,
Colorado
2005, September 6-15: Second NVO Summer School, The Aspen Meadows
Resort, Aspen, Colorado
2006, September 6-14: Third NVO Summer School, The Aspen Meadows
Resort, Aspen, Colorado
2008, September 3-1: Fourth NVO Summer School, The Lodge at Santa Fe, Santa
Fe, New Mexico
2009, April 3: "The Role of the Virtual Observatory in the Next Decade"
2010, October: Founding document: "A Vision for the U.S. Virtual Astronomical Observatory"
2010, May 15: The NSF and NASA announce a cooperative agreement to
create a new research facility for astronomy — the Virtual Astronomical
Observatory.
2011, November 30: "VO Community Day" in Boston, Mass., showcasing VO tools to the
astronomical community.
2011, December 7: "VO Community Day" in Pasadena, Calif., showcasing VO tools to the
astronomical community.
2012, January 8: "VO Community Day" and Educator Workshop, Austin, Texas: "Science Tools for
Data-Intensive Astronomy," showcasing VO tools to the astronomical community.
2012, March 13: "VO Community Day" in Tucson, Arizona, showcasing VO tools to the
astronomical community.
2012, November 14: "VO Community Day" in Ann Arbor, Mich., showcasing VO tools to the
astronomical community.
2012, November 29: "VO Community Day" in Baltimore, Maryland, showcasing VO tools to the
astronomical community.
PHOTO CREDITS, top to bottom
- Checking cables: John Glaspey / NOAO / AURA / NSF
- 2MASS: Photo by Rae Stiening
- Composite Image of M81: Hubble Space Telescope (HST) data from NASA, ESA, and A. Zezas (Harvard-Smithsonian Center for Astrophysics);
GALEX data from NASA, JPL-Caltech, GALEX Team, J. Huchra et al. [Harvard-Smithsonian Center for Astrophysics];
Spitzer data from NASA, JPL-Caltech, Harvard-Smithsonian Center for Astrophysics
- Andromeda Galaxy montage: E. Hubble, NASA, ESA, R. Gendler, Z. Levay and the Hubble Heritage Team
- Students using computers: STScI Office of Public Outreach (OPO)
- SDSS-III camera CCD photo: Sloan Digital Sky Survey
- Composite Image of Antennae galaxies: NASA, ESA, SAO, CXC, JPL-Caltech, and STScI
- Moore's Law: From Towards the National Virtual Observatory A Report Prepared by the National Virtual Observatory Science Definition Team
- Galaxy Zoo image: Sloan Digital Sky Survey, Galaxy Zoo; composite by Richard Nowell and Hannah Hutchins
- Students using computers: STScI Office of Public Outreach (OPO)
- Stellar jet in the Carina Nebula: NASA, ESA, and the Hubble SM4 ERO Team
- NVO Logo: National Virtual Observatory (NVO)
- NASA Astrophysics Information Services: Chart from Towards the National Virtual Observatory — A Report Prepared by the National Virtual Observatory Science Definition Team
- Logos: Top: National Virtual Observatory; Bottom: Travelocity.com
- IVOA Chart: Marco C. Leoni
- Alex Szalay photo: John Patzer, 2008;
- Jim Gray photo: From 2007 Microsoft press release, copyright 2007, Microsoft